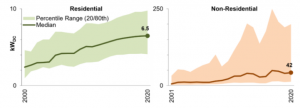
The Berkeley Lab has found that solar photovoltaic (PV) system sizes continue to grow in the United States. In 2020, the median was 6.5 kW for residential systems, up from 2.4 kW in 2000. The median was 42 kW for non-residential systems in 2020.
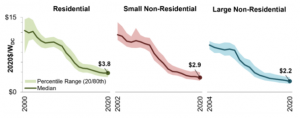
Median installed prices have gone down by roughly $0.4/W per year, on average. However, the price decline has tapered off, with prices dropping since then at roughly $0.1-0.2/W per year since 2014, Berkeley Lab said in its annual Tracking the Sun report. The report used project-level data for about 2.2 million systems installed in 2020.
 Source: Berkeley Lab
The report finds that module efficiencies among residential systems rose from 13.4% in 2002 to 19.8% in 2020, with non-residential systems mirroring the same. In 2020, 8.1% of residential PV installations included battery storage.
According to the report, 94% of residential systems, 71% of small non-residential systems, and 26% of large non-residential PV systems installed in 2020 included microinverters or DC optimizers. Around 48% of all large non-residential systems installed were ground-mounted, and 10% have tracking. In comparison, 18% of small non-residential and 2% residential systems are ground-mounted, with negligible tracking installations.
In 2019-2020, the report found that median prices for residential systems remained effectively flat at $3.8/W, while median prices for small and large non-residential systems fell by $0.2/W.
 Source: Berkeley Lab
Median prices vary substantially across states within each customer segment. For example, among residential systems, median prices in 2020 ranged from $2.9/W in Delaware to $4.6/W in North Carolina.
In the non-residential sector, installed prices are generally higher for systems installed at tax-exempt customer sites than for commercial site hosts. The most pronounced differences occur in large non-residential systems in California, where tax-exempt customers paid a median price of $3.4/W, compared to $2.2/W for commercial customers.
Recently, the U.S. Department of Energy Solar Energy Technologies Office and the National Renewable Energy Laboratory stated that solar could account for as much as 40% of the nation’s electricity supply by 2035 and 45% by 2050.
Solar Energy Industries Association and Wood Mackenzie, in their US Solar Market Insight Q2 2021 report, said that the U.S. added 5 GW of solar in Q1 2021.


