星期三, 2 4 月, 2025
Home PV Finance New interactive map of renewable energy capture prices in Europe

New interactive map of renewable energy capture prices in Europe

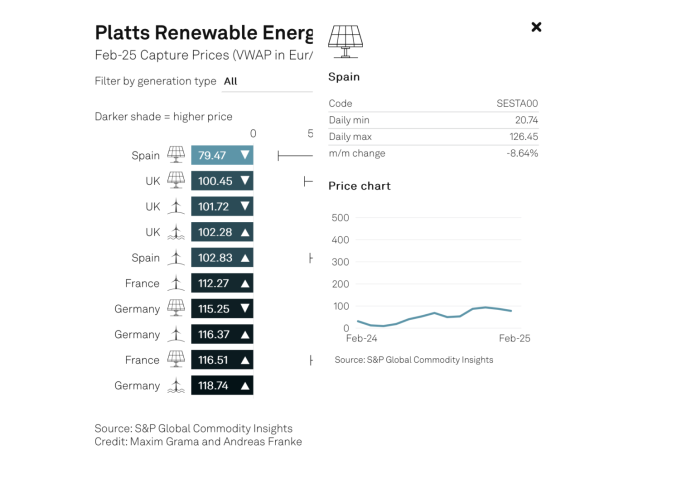
Platts, a division of McGraw-Hill, manages and operates the financial market for futures and options on energy derivative products worldwide. Although it provides subscription-based information on these markets, it also now offers a free online “explorer” tool for renewable energy pricing.

The tool displays the capture price received by wind and solar power assets using hourly production and monthly average price data for Spain, Germany, Italy, France, and the United Kingdom.

It includes a one-year graph showing daily minimum and maximum prices, along with the percentage difference between them.

A pie chart details each country’s monthly generation mix, with installed capacity and generation data available by selecting individual countries.

LEAVE A REPLY

Please enter your comment!
Please enter your name here

- Advertisment -

Most Popular

Ningbo Deye Will Invests 16GWh Energy Storage

Ningbo Deye Technology Group’s subsidiary locked in a pact to build a colossal energy storage facility, not only boosting its stock value but also...

Trump tariffs on solar panels to spur Chinese investment in the US

Chinese companies are likely to increase their production of solar panels in the US to mitigate any fallout from possible higher tariffs on their...

How U.S. tariffs could affect solar imports

On Feb. 1, the United States announced a 25% tariff on Mexican goods and non-oil and gas imports from Canada. Canadian oil and gas...

Solar power to energize European football, UEFA teaming up with SolarPower Europe

The Union of European Football Associations (UEFA) and SolarPower Europe have partnered to advance sustainability in European football through solar energy. The collaboration focuses on...