A new tool from the U.S. Department of Energy’s Berkeley Lab allows users to explore trends in wholesale electricity prices and their relationship to solar and wind generation.whole
The Renewables and Wholesale Electricity Prices (ReWEP) tool allows users to compare pricing trends across locations, regions, and a number of different timeframes, down to the nodal level. These comparisons help illustrate the ongoing interactions between solar and wind generation and wholesale energy prices.
The ReWEP tool consists of maps, time series, and other interactive figures that provide a general overview of how average pricing, negative price frequency, and extreme high prices vary over time; and a summary of how pricing patterns are related to solar and wind generation. Interactive functionality allows investigation by transmission regions (ISOs/RTOs), year, and season, and over diurnal cycles.

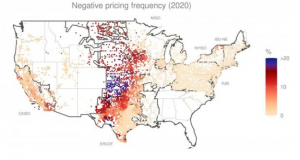
This screen-shot from the ReWEP tool shows the distribution of negative prices across nodes, indicating the concentration of negative prices in the wind-heavy regions near Oklahoma and Kansas.
Image: Berkeley Lab
Berkeley Lab said the tool can reveal some key observations:
Solar and wind influence the geographic and temporal distribution of prices, impacts that are somewhat hidden at the regional level.
Impacts of solar and wind on prices vary by region: solar impacts are highest in California while wind has big impacts in the interior of the country.
Solar strongly impacts diurnal price profiles, especially in California, while wind’s impacts vary across hours depending on prevailing wind patterns.
Frequent negative prices in the wind-rich interior of the country, in northern New York, and in northern New England all highlight regions ripe for transmission investment.
Overall, average wholesale prices have declined over the last decade, but prices in regions with high wind or solar have declined most during hours of high wind and solar generation.
The ReWEP tool is intended to provide users a way to explore ongoing changes to pricing patterns, including those related to growth in wind and solar deployment.


