The huge additions of rooftop solar and large scale wind and solar projects combined to help drive emissions from Australia’s main grid to a record low in the first quarter, and helped push average wholesale prices to their lowest point in four years.
The Australian Energy Market Operator – in its latest Quarterly Energy Dynamics report – describes a volatile first quarter of 2020 for the main grid, which experienced days of huge demand and volatility, record temperatures, bushfires, several transmission failures that caused separations of state grids, then a spate of unusually mild weather that caused record demand lows, and finally the impact of the Covid-19 pandemic, including a crash in the international oil market.
- “It’s been an extraordinary start to the year,” said AEMO chief executive Audrey Zibelman said in a statement accompanying the report.
 The end result, however, was that emissions hit their lowest level in the first quarter since the creation of the National Electricity Market more than two decades ago, and prices fell to their lowest levels since 2016.
Grid emissions fell to an average of 0.74 tCO2-e/MWh, a fall of 20 per cent over the last three years. “Continued increases in both grid-scale renewable projects and rooftop PV, combined with lower demand and coal-fired generation, continued to drive the downward trend,” the AEMO report said.
In January, despite the volatility, the average price on the NEM was down 50% to $66 per megawatt hour (MWh), down from $130/MWh in Q1 2019, while the average price in South Australia, with the highest level of wind and solar, fell by two thirds to an average of $65/MWh.
And despite the volatility brought about by that series of disparate events – heatwaves, bushfires, record demand, a high number of coal plant outages in February and March, record levels of minimum demand, and Covid-19 – the profile of the grid continued to change towards renewables and away from fossil fuels.
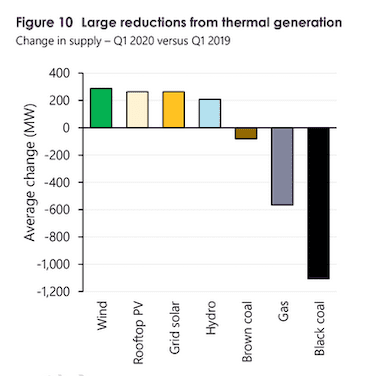
 This graph above sums it up best. Wind farms, grid scale solar and rooftop PV, along with hydro, all registered significant rises in average generation in the first quarter, compared to the same period a year earlier.
 The combination of lower demand and more renewables sent the amount of all fossil fuel generators down, with black coal the worst hit, followed by gas.
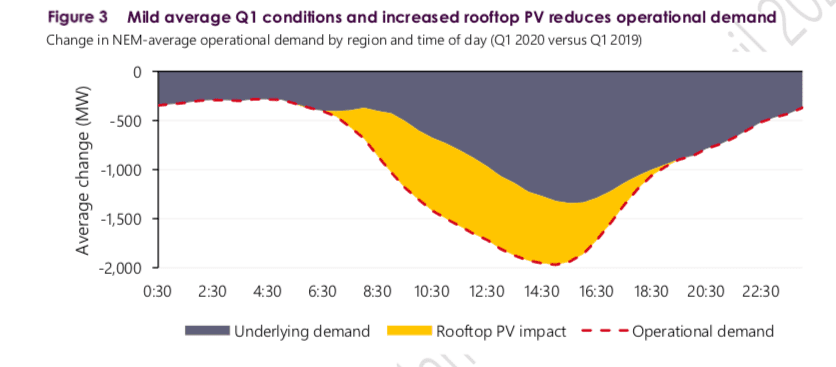
Rooftop solar also had an impact – increasing the reduction in operating demand (partially caused by less air-con and cooling use during a comparatively mild February and March. Lower operational demand translates into lower prices.

And the fossil fuel generators found themselves displaced even further by the increased amount of large scale wind and solar farms, with solar pushing out coal and gas during the day, and hydro displacing the fossil fuels in the morning and evening peaks.
The AEMO report credits the price falls to a combination of events – the reduced demand, the increase in large scale renewables, and the lower gas prices, which in turn helped force a change of bidding by the principal black coal generators. And this came despite the huge volatility that came with demand spikes, unexpected outages, and separation events.
“Although electricity and gas prices were generally lower this quarter, major power system separation events following bushfire and storm activity created volatility in both energy and frequency control markets,” Zibelman said.
It also meant that total NEM system costs – relating to frequency services, emergency supplies, curtailment and directions – increased to $310 million, or 8% of the energy costs for the quarter, much higher than its typical value of 1-2%.
This was driven by three major power system separation events during the quarter, including the 18-day separation of the Victorian and South Australian power systems following storm damage to transmission towers in Victoria. These events contributed 74 per cent of total NEM systems costs for the quarter.
As a side-product, it resulted in a windfall for battery storage revenue, and some gas generators, and also caused curtailment issues for wind farms. See South Australia big batteries collect windfall, as wind farms duck for cover.
Still, AEMO’s growing concern is no longer solely on growing peaks in demand, and the potential lack of sufficient supplies, but falling troughs, and the lack of demand.
“Sunny conditions and mild temperatures broke first quarter minimum demand records in both Victoria and South Australia, while a new minimum demand record was set for the second consecutive quarter in WesternAustralia,” Zibelman said.
This is concentrating the minds of AEMO, and transmission companies, because of the potential systems when operating demand falls below what they say is a critical level.
This occurs when overall demand is low and rooftop solar PV production is high, and is leading AEMO to craft new policies to help “orchestrate” and gain increased visibility over distributed energy resources such as rooftop PV and battery storage.
A distributed energy roadmap has already been drawn up in W.A., one of the states mosts affected (and which is less encumbered by the layers of regulatory red tape than in the main grid), and a similar roadmap will follow for the NEM.
AEMO also confirmed private analyst observations that the fall in demand as a result of Covid-19 had been relatively mild – along with the weather – in Australia (3-4 per cent) compared to falls of more than 20 per cent and up to 30 per cent in Europe and the US.
 It noted, however, that electricity futures contracts traded on the Australian Stock Exchange for the Q2 and Q3 2020 quarters fell 11% in the last two weeks of March. “Future prices represent market expectations of economic activity and reduced demand,” it said.
Energy minister Angus Taylor issued a statement welcoming the price falls, citing only the fall in gas prices, lower bids from “dispatchable generation” (coal and gas) and lower demand. The 412 word statement from Taylor made no mention of renewables, or their impact on the market, nor did it mention the big reduction in emissions.


