David Dixon, Senior Analyst at Rystad Energy, has posted analytics across his social media stating that the Australian National Electricity Market (NEM) saw over 25% renewable generation for the month of March.
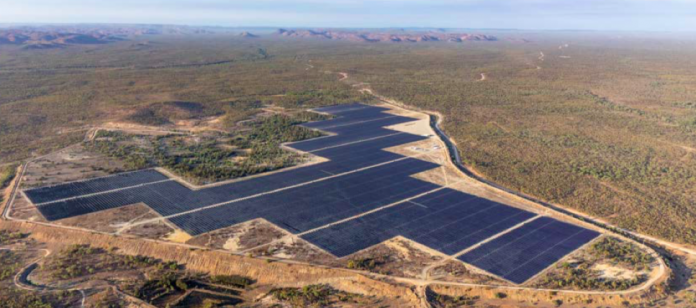
Of the 421 MW AC of utility-scale solar being tracked by Rystad, Genex Power’s Kidston Solar Farm in Queensland showed the highest AC CF (32.0%). Kidston was followed by Neoen’s Numurkah Solar Farm in Victoria (31.6%), John Laing’s Finley Solar Farm in NSW (31.6%), and Enel Green Power/DIF’s Bungala stage 1 in South Australia (31.6%).
On the windier side of things, Rystad recorded PARF’s 453 MW (AC) coopers Gap Wind Farm generating 57.4 GWh, a near doubling of its generation in the month of February.

According to Energy Networks Australia (ENA) March saw clear reductions in the operational demand in the NEM. The mean reduction across the NEM was 6.7% with South Australia experiencing the largest reduction with 11.1%, a new record low, says ENA.
While the temptation is there, it must be said that it is still too early for incoming data to conclusively tie the increased presence of renewables in the grid to Covid-19 restrictions. As Lumi Adisa of Cornwall Insight Australia told pv magazine Australia: “All in all, given the intricate dependencies between all sectors of the economy, a true estimate of the impact of this pandemic on the energy sector would require a much broader and dynamic spectrum of analysis. This of course includes metrics beyond demand; such as prices and supply, including ‘prosumers’ with rooftop solar whom (sic) play a key role in determining the shape and scale of operational demand through the day.”

However, what can be said of the energy market under Covid-19 conditions, is that solar households are actually saving more on their electricity bills than before, that is at least according to Solar Analytics.
Across its fleet of solar sites, Solar Analytics found that general energy consumption has not risen noticeably since lockdown, but the consumption of solar power by those homes with solar PV installed is up dramatically. According to Solar Analytics network of 35,000 solar sites, 20% have increased their self-consumption by 20%. This could mean an estimated saving of an extra $62 quarterly.
As Australia ebbs into Autumn, it is expected for the data to become starker. With lights coming on earlier and more people reaching for their heating, Solar Analytics believes rooftop solar will only continue to demonstrate its utility.
According to Solar Analytics co-founder Renate Egan, who’s family employs a 12-year-old 1kW solar array, “Two of us have been working from home for three and a half weeks now. If I compare March this year with March last year our self-consumption has gone up by 10% and we were only working from home for half of March,” Egan said. “The numbers aren’t huge as we are very energy aware – but I expect this will be more dramatic in April because we expect to be home for the entire month. If I look just at the last three weeks, we are self-consuming 76% – up from 63% this time last year.”


